An economic assessment of healthcare capital investment
While the costs of health infrastructure investment proposals are relatively straightforward to quantify, the resulting health benefits are much harder to value. This paper describes New South Wales Health’s experience and the assessment method it uses to assess cost versus outcome
Elsie Choy, Health Infrastructure, New South Wales
Health infrastructure is important in influencing the outcomes, quality and efficiency of the healthcare system. Decisions about public funding of health infrastructure require consideration of relative costs and benefits of options. In New South Wales (NSW), considerable efforts have been placed on benefits assessment in the economic appraisal of capital projects. This involves qualitative assessment of the extent to which options improve patient access to health services and economic efficiency, and quantitative assessment of the value of health benefits to the greatest practicable extent.
This paper describes the NSW experience and approach to valuing health benefits in major capital projects. Since 2009, NSW Health has applied quantitative valuation (monetisation) of benefits for investment in single-purpose health facilities such as radiotherapy treatment facilities. This is done by comparing the number of additional patients receiving service and benefits, accounting for changes in patient disability burdens as a result of treatment and applying survival rate assumptions based on findings from research literature.
Assessing and quantifying benefits associated with investment in infrastructure involving a range of health facilities and services is much more difficult, given the complexity in identifying the cause and effects in health outcome improvements for a wide range of medical conditions. The method for single-purpose facilities was expanded to consider a range of clinical treatments in general hospital environments.
Method of valuation
The method is based on the causal relationship that there would be reduction in pain and suffering and aversion of mortality for seriously ill patients who would otherwise not be treated without the hospital development because the existing hospital is at capacity.
Patients who access treatment at a public hospital are expected to experience a reduction in their disability (including pain and suffering) caused by the health condition for which they seek treatment. The degree of disability that a medical condition or disease inflicts on the sufferer is measured by its disability weight.
The assessment therefore involves estimation of average of time for which the disability burden of a patient is reduced as a result of treatment at a hospital. The reduction in pain and suffering is estimated by multiplying the number of such patients by the average reduction in disability for each patient, their years of remaining life and the Value of a Statistical Life Year (VSLY). The formula used for this calculation is:
Change in number of clinical separations x disability weight (pre-treatment) x reduction in burden of disability (years) x VSLY
The steps are:
i. Identify a representative medical condition or disease from each of the hospital’s Service Related Groups (SRGs) and the estimated average period of time for which the disability burden is reduced as a result of treatment at a hospital.
ii. Apply disability weights for each condition/disease that has been published by the Australian Institute of Health and Welfare and estimate the reduction in disability burden as a result of treatment.
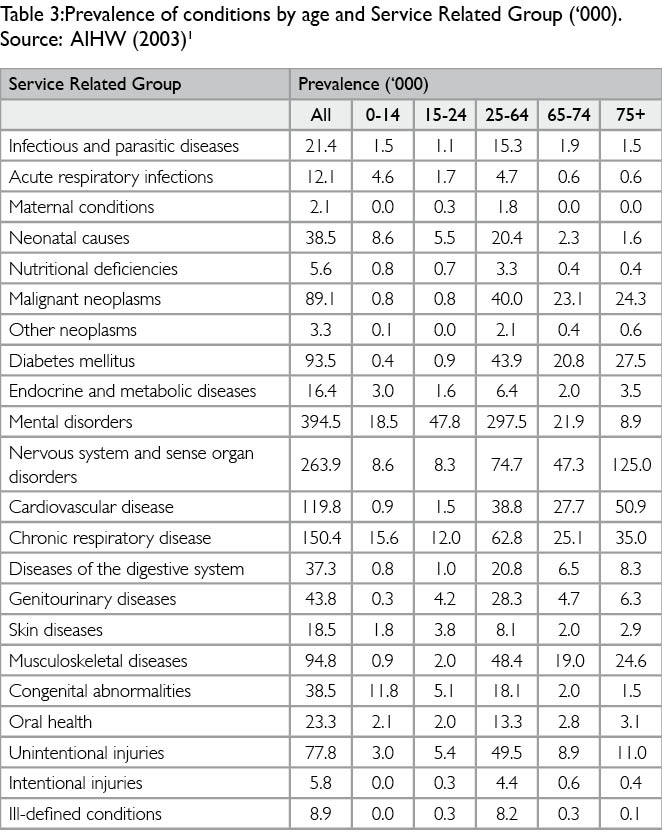
iii. Estimate the average age at which the patient is treated at the hospital by examining the prevalence of each condition/disease in the Australian population.
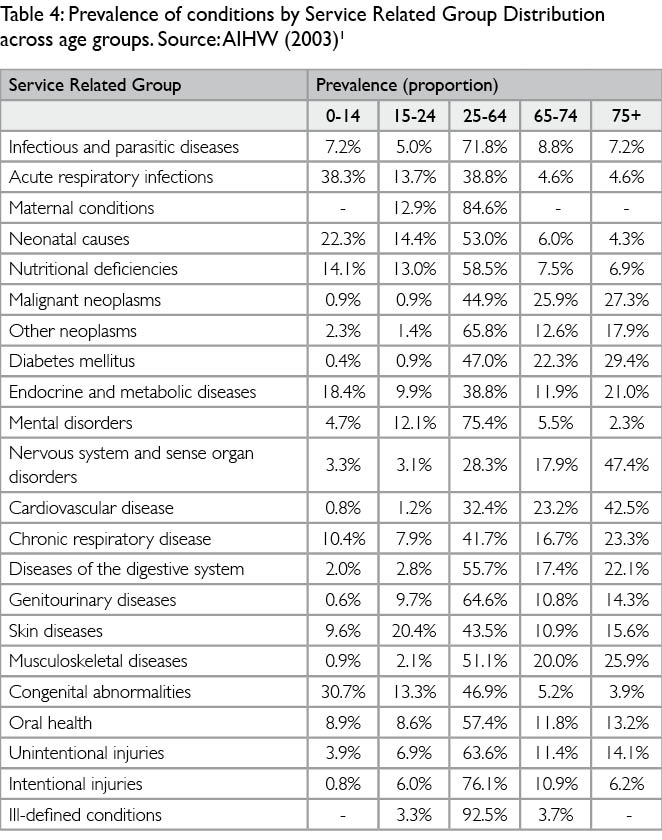
iv. Estimate the percentage distribution of prevalence of conditions by service group and by age.
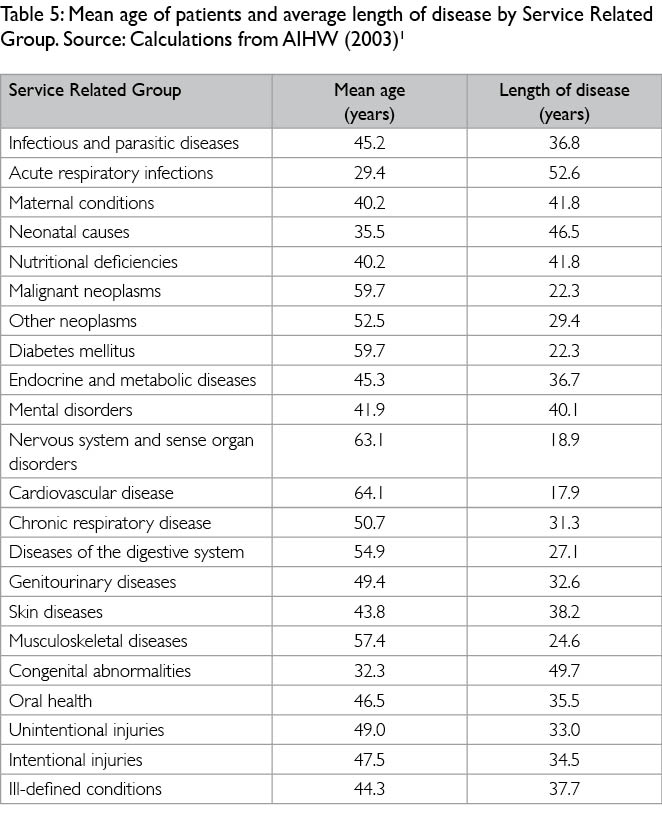
v. Using the formula from step (iv) and assuming the average life expectancy, estimate the mean age at which a patient is likely to present at the hospital for treatment, as well as the duration over which they will experience a reduction in their disability.
vi. Calculate the increase in the activity levels for each SRG by comparing the current levels and the projected activity in future years.
vii. Estimate the patient heath gain by multiplying (v), (vi) and the VSLY.
The quantification exercise considers alternative scenarios regarding the magnitude of reduction in disability burden across all health conditions and diseases.
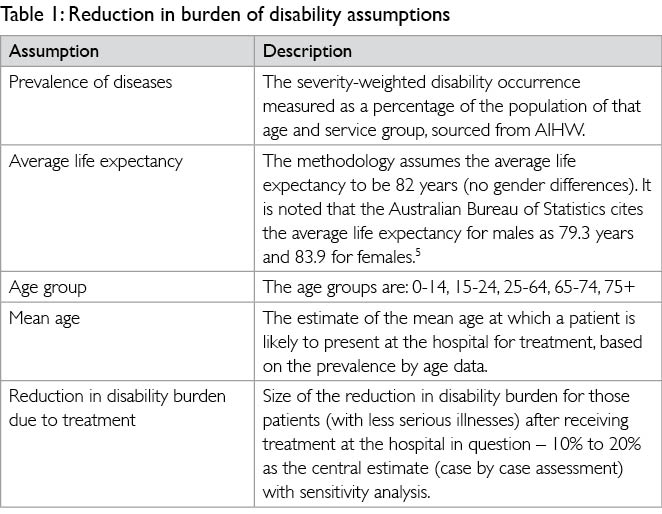
Assumptions
Change in number of clinical separations: The change in the number of clinical separations is obtained by comparing the current and the projected level of activity in future years of each SRG provided in the public hospital.
The SRG is a classification system for grouping hospital inpatient records into categories corresponding to clinical divisions of hospital activity. The major purpose of the classification is to assist with the planning of health services.
This disease classification is then translated into an Australian medical coding system, ie Australian Refined Diagnosis Related Groups (AR-DRG) as outlined in the Australian Institute of Health And Welfare (AIHW) report, The Burden of Disease and Injury in Australia 2003.1 Most classifications used in the AIHW study are consistent with the classifications used by World Health Organization ie International Classification of Disease (ICD) system.2
Disability weights: The disability weights are sourced from the AIHW, which collates information mainly from the Global Burden of Disease (GBD) study3 and the Netherlands study.4 for some diseases, there is no equivalent in either the GBD or Netherlands set of weights. In these instances, the weights are specifically derived from earlier Australian studies. The disability burden weights are measured as a number on a scale of 0-1, where 0 is assigned to a state comparable to perfect health and 1 is assigned to death.
Reduction in burden of disability: Currently, there is insufficient data from the medical literature to precisely determine the treatment-enabled reduction in disability burden across the wide spectrum of service groups. Consequently, the quantification exercise considers alternative scenarios of a 10%, 20% and 30% reduction in disability burden across all health conditions and diseases (with 20% being the central case).
The computation of the reduction in burden of disability (years) requires making a number of assumptions, which are described in Table 1.
Value of Statistical Life Year (VSLY): The value of statistical life (VSL) is sourced from an Australian Office of Best Practice Regulation’s Guidance Note. The VSL is an estimate of the financial value society places on reducing the average number of deaths by one. The VSL is most appropriately measured by estimating how much society is willing to pay to reduce the risk of death. A number of empirical studies have derived estimates for the VSL. In reviewing the studies relevant to Australia, Abelson (2007)6 argues that the most credible estimate is AUS$3.5m for the VSL and AUS$151,000 for the VSLY (in 2007 dollars). These estimates represent an average and are based on a healthy person living for another 40 years. The VSLY in 2011/12 dollars is assumed to be AUS$168,000.
Application to capital investment in regional hospitals
The Australian and state jurisdictions are committed to making long-term improvements in the health systems for the community. Capital investment is needed to meet increased demand in health services as a result of the ageing population and to address the rising burden of chronic disease. One of the investment priority areas is regional health infrastructure.
The Australian Government has committed to a total of AUS$1.8 billion funding to improve and develop regional health infrastructure. Funding allocation is decided through a process of application and assessment by an independent advisory board. The priority regional hospital funding programme will improve access to essential health services to as many Australians as possible living in rural, regional and remote areas through investments in health infrastructure. The objective is to provide equitable access to, and affordable services for, patients in rural, regional and remote Australia, and the needs of Indigenous Australians and people experiencing socio-economic disadvantage. This will help close the gap in health outcomes between major metropolitan and regional areas of Australia.
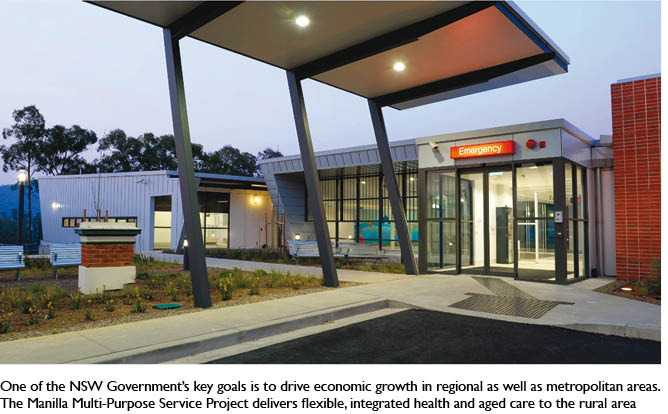
NSW is the largest state in Australia with a population of 7.3 million. It is estimated that 4.6 million people (63%) live in the Sydney metropolitan area and 2.7 million people (37%) live in regional NSW in 2010. The population is projected to reach 7.9 million in 2021. One of the NSW Government’s key goals is to drive economic growth in regional NSW. This is underpinned by the need to balance population growth between regional and metropolitan areas so all people have access to good economic and lifestyle opportunities.
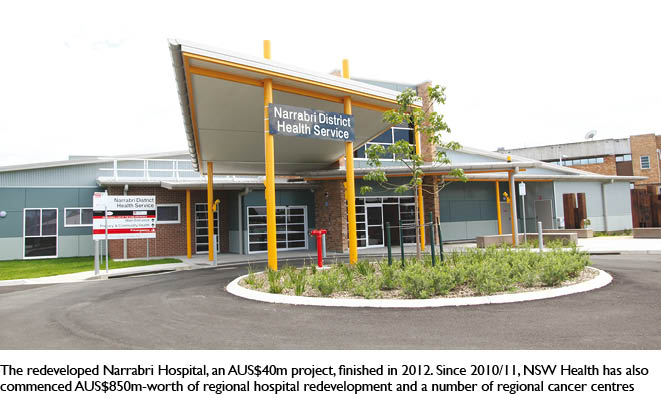
Since 2010/11, NSW Health has commenced a number of regional hospital redevelopment projects including Port Macquarie Hospital, Wagga Wagga Hospital, Dubbo Hospital Project, Tamworth Hospital and Bega Valley Hospital at a total capital cost of AUS$850m, jointly funded by the NSW and Australian Governments. This is in addition to the AUS$40m Narrabri Hospital redevelopment which was completed in 2012 and a number of regional cancer centres at a total capital cost of AUS$149m at Coffs Harbour, Lismore, Port Macquarie, Gosford, Illawarra, Shoalhaven and Tamworth.
In the project planning and development phase, NSW Health applies cost benefit analysis, including the health benefit quantification method described here, to demonstrate the net benefits of each project. The analysis forms a key component of the economic appraisal of the project.
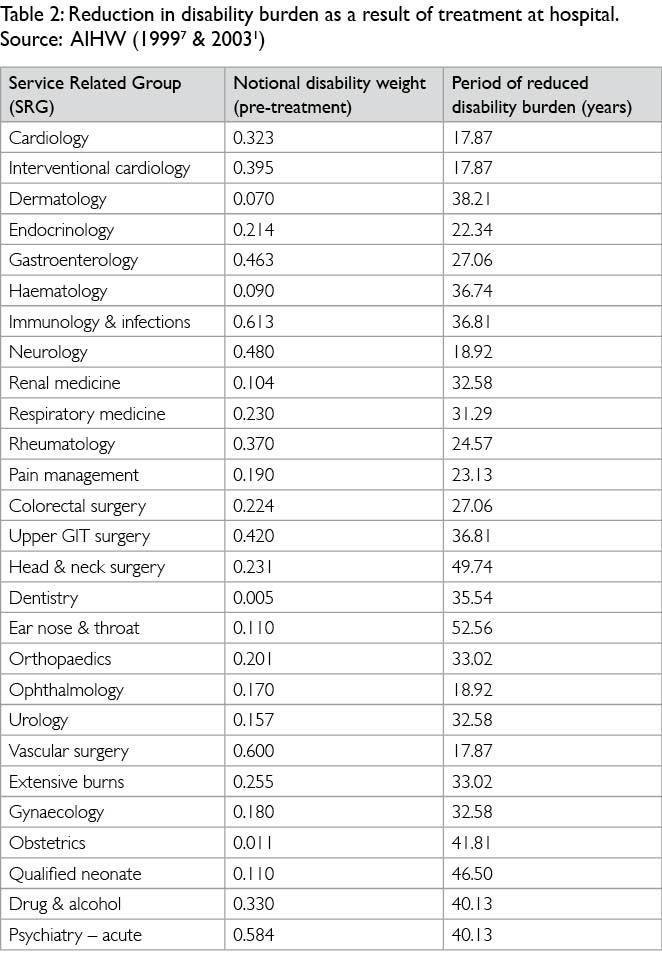
Table 2 shows the disability weights associated with the medical condition or disease from each of the hospital’s SRGs, as well as the estimated average period of time for which the disability burden is reduced as a result of hospital treatment. A simplifying assumption is made that treatment results in a permanent reduction in disability. As treatment will only result in a temporary remission for some chronic health conditions or diseases, a modest average reduction in disability as a result of treatment at the regional hospital is assumed. For the purpose of the assessment method, a notional disability weight is nominated based on the range of disability weights for various diseases within each SRG.
Prevalence of diseases and health conditions
The estimated average period of time for which the disability burden of a patient is reduced as a result of treatment at the regional hospital is dependent on the average age at which the patient is treated at the hospital. This is estimated by examining the prevalence of each disease or condition in the Australian population, and assuming that a patient who is successfully treated will live on until the current average life expectancy in Australia.
Table 4 shows the distribution across age groups of conditions by Service Related Group. This distribution is calculated from the prevalence numbers in Table 3. Using the information in Table 4 and assuming the average life expectancy to be 82 years, the mean age at which a patient is likely to present at the hospital for treatment, as well as the duration over which they will experience a reduction in disability, can be calculated as shown in Table 5.
Projected activity levels
The projected patient demand at each hospital by SRG is based on the Local Health District’s clinical service planning data over a five year and ten year projection period. The activities are separated into day only and overnight.
In the economic appraisal, it is assumed that the base case (keep safe and operating) will only enable hospitals to meet the actual combined activity level or increase to the levels using existing capacity. It is then assumed that hospital redevelopment and expansion will enable them to meet activity projections to a 10-year planning horizon.
Magnitude of potential reduction in disability burden
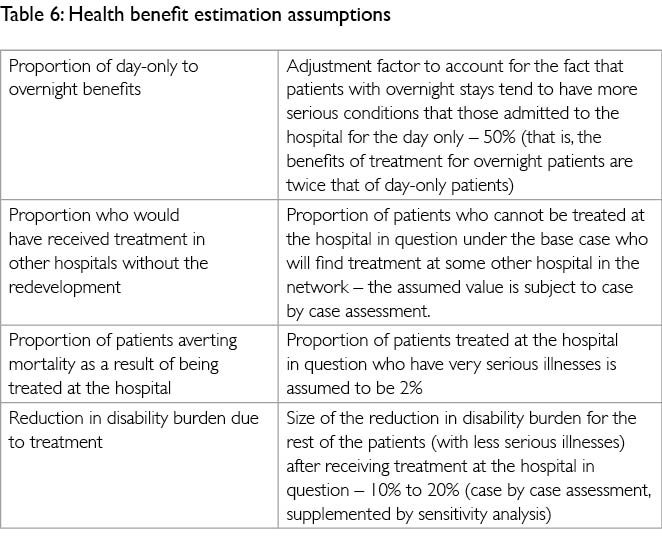
There is currently insufficient data from the medical empirical literature to precisely determine the treatment-enabled reduction in disability burden such as years of life lost (YLL) and years lost due to disability (YLD) averted across the wide spectrum of health conditions and diseases shown in Tables 3, 4 and 5. Instead, the assumptions shown in Table 6 are used in estimating the health benefits to patients.
Estimated health benefits
Based on the above parameters and assumptions, the health benefits of each regional expansion and redevelopment are estimated for each year over an analysis period of 20 years. The present value using a range of alternative real discount rates (4%, 7% and 10%) is then calculated.
Results and sensitivity testing
The economic appraisal of regional health capital projects has yielded a benefit cost ratio (BCR) within the range of 1.2 and 2 under a real discount rate of 7%. In each instance, sensitivity analysis is undertaken to test the robustness of the BCR to changes in key parameters and assumptions. As the project benefits encompass other benefits beyond patient health, the result of the quantification exercise is a conservative estimate of the project’s total benefits.
Limitations
It is acknowledged that there are constraints/limitations in the above approach, as health benefit valuations may differ between individuals due to differences in age, education, risk aversion or time preference.
The mapping of the disability weights to the SRG is notionally based on the range of disability weights for various diseases within each SRG. Collection and analysis of detailed activity data will help inform the judgement in formulating the appropriate disability weight for each SRG.
Assuming a uniform 20% reduction in disability burden due to treatment means the method can put a value to treatment activity. The challenge is to base the reduction more on evidence rather than on uniform assumptions. In taking this method forward, an area for further improvement is to base the assessment of reduction in burden of disability on the health impact of the specific treatments and models of care under each project option considered.
Conclusions
Subjecting capital proposals to benefit cost assessment supports sound decision-making on strategic investments in the health system underpinning improvements in efficiency, access and outcomes of healthcare. Capital investment in health infrastructure will impact on the operation of health facilities and contribute to improvements in healthcare delivery. The health impacts (benefits) usually include patients’ quality and quantity of life. These benefits need to be evaluated against the capital and operating costs associated with the project in question. The health benefit quantification or monetisation is a key step in providing a picture of each project’s economic, environmental and social merits.
In NSW, the approach and method outlined in this paper has been used to improve the rigour and quality of economic appraisals of health infrastructure projects. In the projects where quantification of health benefits is feasible, it has been demonstrated that the health benefits associated with the capital investments exceed the resource costs.
Valuing health benefits is less complex for specific-purpose health infrastructure such as emergency department upgrades or cancer centres. There is an opportunity for further study of the link between a capital investment and its resulting health, social, community and other benefits. For example, it would be helpful to better understand how the design of health facilities contributes to improvements in health services delivery and patient health outcomes.
Acknowledgements
This paper is jointly sponsored by Health Infrastructure and NSW Treasury. The benefit assessment method described in this paper was developed by Health Infrastructure over the past three years in conjunction with NSW Treasury and its economic adviser. The invaluable comments by Mr Robert Rust and Mr Onnes Hendrata of Health Infrastructure, Mr Rick Sondalini and Ms Clare Wilde of NSW Treasury, Ms Cathryn Cox of the NSW Ministry of Health, and Mr David Greig and Dr Yuan Chou of ACIL Tasman are gratefully acknowledged.
Author
Elsie Choy is general manager, Business Strategy for Health Infrastructure, New South Wales.
References
1. Begg S, Vos T, Barker B, Stevenson C, Stanley L & Lopez AD, The burden of disease and injury in Australia 2003, AIHW Cat. No. PHE 82, Canberra; May 2007. www.aihw.gov.au/publications/hwe/bodaiia03/bodaiia03.pdf
2. World Health Organization (WHO). International Statistical Classification of Diseases and Related Health Problems, Tenth Revision. Geneva; 1992
3. Murray CJL & Lopez AD (eds). The global burden of disease: a comprehensive assessment of mortality and disability from diseases, injuries, and risk factors in 1990 and projected to 2020. Vol I. Cambridge, MA: Harvard School of Public Health on behalf of the World Health Organization & the World Bank, 1996a.
4. Stouthard ME, Essink-Bot M, Bonsel GJ, Barendregt JJ, Kramers PGN, van de Water HPA et al, Disability weights for diseases in The Netherlands. Rotterdam: Department of Health, Erasmus University Rotterdam; 1997.
5. Australian Bureau of Statistics. Australian Social Trends March 2011. Accessed at www.ausstats.abs.gov.au/ausstats/subscriber.nsf/LookupAttach/4102.0Publication25.03.114/$File/41020_HealthOMC_Mar2011.pdf
6. Abelson P. Establishing a Monetary Value for Lives Saved: Issues and Controversies, Working Papers in Cost benefit Analysis WP 2008-2, Department of Finance and Deregulation; 2007. Accessed at www.finance.gov.au/obpr/docs/Working-paper-2-Peter-Abelson.pdf
7. Mathers C, Vos T & Stevenson C, The Burden of Disease and Injury in Australia. Australian Institute of Health and Welfare, AIHW Cat. No. PHE 17, Canberra; 1999.
Further reading
Mathers C, Bernard C, Iburg KM, Inoue M, Fat DM, Shibuya K, Stein C, Tomijima N & Xu H, 2004, Global Burden of Disease in 2002: Data Sources, Methods and Results, Global Programme on Evidence for Health Policy Discussion Paper No. 54
NSW 2021, A Plan to make NSW Number One, NSW Government; 2011
NSW Department of Planning & Infrastructure. Population NSW Bulletin, No 14; 2011.
NSW Health. Guidelines for the Economic Appraisal of Capital Projects (Supplementary to NSW Government Guidelines); 2011.
NSW Treasury. NSW Government Guidelines for Economic Appraisal, Policy & Guidelines Paper, Sydney, Office of Financial Management; 2007.
NSW Treasury. Infrastructure Statement 2010/11, Budget Paper No.4, Sydney, Office of Financial Management; 2010.
Office of Best Practice Regulation, Value of Statistical Life, Office of Best Practice Regulation, Department of Finance and Deregulation; November 2008. www.finance.gov.au/obpr/docs/ValuingStatisticalLife.rtf
|

1.1.jpg)


|